Custom Cut Scores and Benchmark Ranges
Overview
The Custom Cut Score feature in Equity Analytics allows districts to define their own performance bands for assessments using raw percent scores out of 100. These custom thresholds replace the default calculations provided by assessment vendors.
Districts can use this feature to align assessment performance classifications with local accountability goals while maintaining consistent reporting across all schools.
Once defined, custom cut scores automatically apply to:
- Impact Dashboards
- Accountability Projections
- CSV and PDF exports
Set it once. See it everywhere. Instantly.
Why It Matters
- Ensures consistent performance level classification across schools and teachers in the district.
- Provides flexibility to adjust to state policy changes without waiting for vendor updates.
- Improves transparency by making cut scores visible in both the web interface and downloadable PDF and CSV files.
How It Works
-
District-Level Control
Only users with district administrator permissions can edit cut scores. -
Subject-Specific Thresholds
Admins can define unique ranges for each grade and subject. -
Bands and Ranges
Each performance band represents a contiguous percent range from 0 to 100 with no gaps. -
Audit and Rollback
All changes are logged with a timestamp and user name, and districts can revert to vendor defaults at any time.
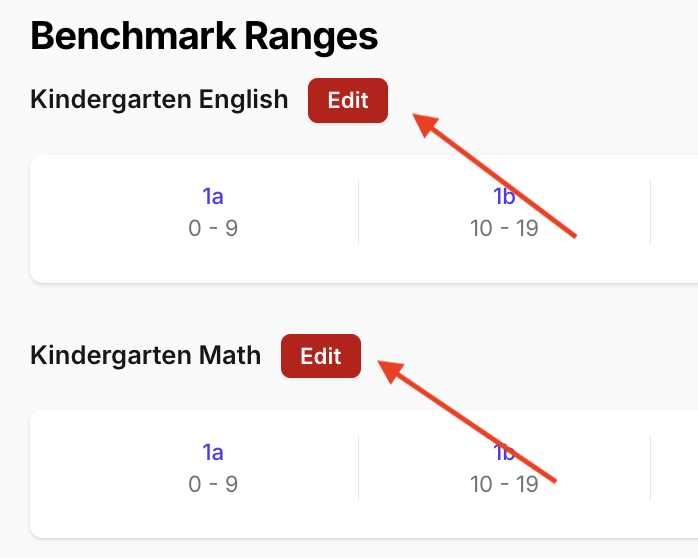
Example Benchmark Ranges
Below are sample benchmark ranges as they appear on the Benchmark Ranges page.
3rd Grade English
| 1a | 1b | 2a | 2b | 3a | 3b | 4 | 5 |
|---|---|---|---|---|---|---|---|
| 0–17 | 18–19 | 20–29 | 30–39 | 40–49 | 50–59 | 60–79 | 80–100 |
3rd Grade Math
| 1a | 1b | 2a | 2b | 3a | 3b | 4 | 5 |
|---|---|---|---|---|---|---|---|
| 0–9 | 10–19 | 20–29 | 30–39 | 40–49 | 50–59 | 60–79 | 80–100 |
8th Grade Science
| 1 | 2 | 3 | 4 | 5 |
|---|---|---|---|---|
| 0–19 | 20–39 | 40–59 | 60–79 | 80–100 |
PDF and CSV Export Example
When a district downloads the Benchmark Ranges CSV, it contains the grade, subject, and the cut_scores list.
The cut_scores column lists the lower bound of each band in ascending order.
| grade | subject | cut_scores |
|---|---|---|
| 3rd Grade | English | 0,18,20,30,40,50,60,80 |
| 3rd Grade | Math | 0,10,20,30,40,50,60,80 |
| 4th Grade | English | 0,10,20,30,40,50,60,80 |
| 4th Grade | Math | 0,10,20,30,40,50,60,80 |
| 5th Grade | English | 0,10,20,30,40,50,60,80 |
| 5th Grade | Math | 0,10,20,30,40,50,60,80 |
| 5th Grade | Science | 0,20,40,60,80 |
| 6th Grade | English | 0,10,20,30,40,50,60,80 |
| 6th Grade | Math | 0,10,20,30,40,50,60,80 |
| 7th Grade | English | 0,10,20,30,40,50,60,80 |
| 7th Grade | Math | 0,10,20,30,40,50,60,80 |
| 8th Grade | English | 0,10,20,30,40,50,60,80 |
| 8th Grade | Math | 0,10,20,30,40,50,60,80 |
| 8th Grade | Science | 0,20,40,60,80 |
| EOC | English | 0,10,20,30,40,50,60,80 |
| EOC | History | 0,20,40,60,80 |
| EOC | Math | 0,10,20,30,40,50,60,80 |
| EOC | Science | 0,20,40,60,80 |
Editing Benchmark Ranges
- Log in to Equity Analytics.
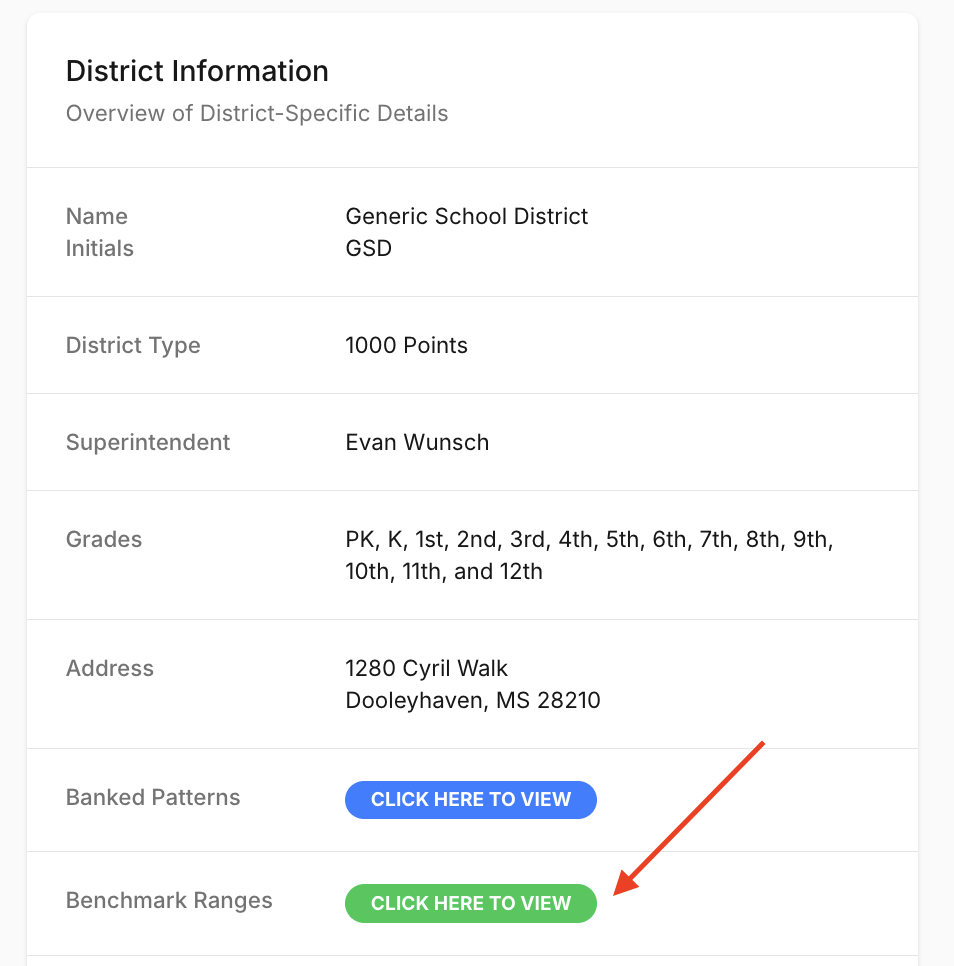
- In District Information, click View Benchmark Ranges (District Admins only).
- Find the grade and subject you want to update, then click Edit.
- Adjust the lower bound for each performance band as needed.
- Click Save to apply the changes across all dashboards, projections, and exports.
Changes to benchmark ranges take effect immediately for all users in the district.
Timing Requirements for Benchmark Ranges
Benchmark ranges must be entered before Impact data is generated for the assessment cycle.
If benchmark ranges are missing or incorrect at the time Impact data is first calculated, the system will proceed using the available defaults. Impact data will not be automatically recalculated later when the ranges are updated.
This timing is critical because:
- Impact calculations reference the benchmark ranges at the moment they are run.
- Updating ranges after Impact data is generated does not retroactively update performance level classifications.
- A full data reprocess is not part of the standard workflow and may require additional support intervention.
Recommendation:
Enter or confirm all benchmark ranges immediately after the assessment schedule is finalized, and before importing student score files for the first time in the cycle.
Support
To enable custom cut scores:
- Contact support@equityanalyticsms.com
- Schedule an implementation review
- Add your district’s desired cut score percentages in the Benchmark Ranges settings